

TRIDENT LIMITED Q1 FY27 RESULTS CONSOLIDATED TOTAL INCOME EBITDA GROWTH NET PROFIT DEEPAK NANDA YARN BUSINESS HOME TEXTILES PAPER & CHEMICALS OPERATIONAL EFFICIENCY COST MANAGEMENT EXPORT OPPORTUNITIES MANUFACTURING TEXTILES INDIA NATIONAL
LUDHIANA, PUNJAB, INDIA
By IFAB MEDIA - NEWS BUREAU - July 23, 2026 | 208 19 minutes read





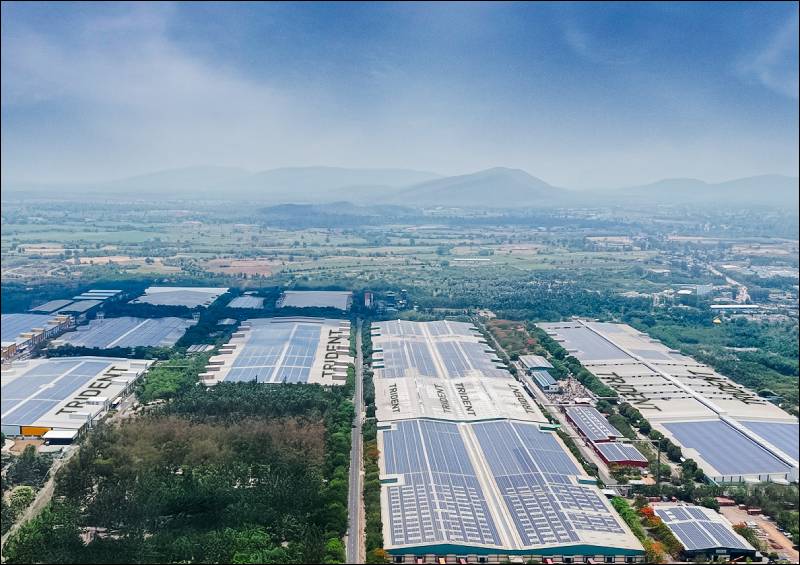
Trident Limited has reported financial results for the First quarter ended 30th June 2026.
Financial highlights for Q1FY27:
- Consolidated Total Income of INR 1803 Crore, up 9% QoQ and 4% YoY.
- Consolidated EBIDTA for the quarter stood at INR 316 Crore, up 27% QoQ and 1% YoY.
- Consolidated Net Profit for the quarter stood at INR 158 Crore, up 55% QoQ and 13% YoY.
Commenting on the results, Deepak Nanda, Managing Director, Trident Limited, said, “Trident Limited delivered a strong performance in Q1FY27, reporting consolidated total income of INR 1,803 crore, up 4.4% YoY and 9.3% QoQ. EBITDA stood at INR 316 crore, registering a robust 27.4% sequential growth, while Profit Before Tax increased to INR 216 crore, reflecting a 15.2% YoY growth. Net Profit for the quarter grew by 12.96% YoY to INR 158 crore, supported by improved yarn prices, disciplined cost management and improved operational efficiencies. The expansion in PBT margin to 11.99% and strong profitability growth underscores the resilience of our business model and our ability to create sustainable value despite a dynamic global operating environment.
Operationally, the quarter reflected the strength of our execution capabilities and continued focus on productivity enhancement. Improved cost efficiencies, better asset utilisation and disciplined operational management contributed to healthy margin expansion and strong sequential improvement in earnings.
We remain optimistic about export opportunities as global supply chains continue to diversify and customers increasingly seek reliable sourcing partners. With our integrated manufacturing capabilities, diversified product portfolio and strong international presence, we are well-positioned to capitalise on emerging global opportunities and drive sustainable long-term growth.”
Business Performance:
- Yarn business consolidated revenue for the Q1FY27 stood at INR 954 Crore.
- Home Textile business consolidated revenue for the Q1FY27 stood at INR 941 Crore.
- Paper and Chemicals business consolidated revenue for Q1FY27 stood at INR 297 Crore.
Financial Performance on Consolidated basis:
*(All figures in INR Crore [rounded off], unless stated otherwise)
|
Particulars |
Q1FY27 |
Q4FY26 |
QoQ Change |
Q1FY26 |
YoY Change |
|
Total Income |
1803 |
1650 |
9.28% |
1727 |
4.42% |
|
EBITDA |
316 |
248 |
27.42% |
312 |
1.46% |
|
EBITDA % |
17.55% |
15.05% |
250bps |
18.06% |
(51bps) |
|
Depreciation |
70 |
70 |
0.64% |
93 |
(24.36%) |
|
Finance Cost |
30 |
32 |
(6.89%) |
31 |
(4.31%) |
|
PBT |
216 |
146 |
47.68% |
188 |
15.19% |
|
PBT % |
11.99% |
8.87% |
312bps |
10.87% |
112bps |
|
Net Profit |
158 |
102 |
55.03% |
140 |
12.96% |
|
Cash Profit |
228 |
172 |
32.94% |
233 |
(1.92%) |
|
EPS (Rs.) |
0.31 |
0.20 |
55.01% |
0.27 |
15.70% |
*% change as per actuals.


