

TRIDENT LIMITED Q2FY27 RESULTS H1FY27 RESULTS FINANCIAL PERFORMANCE NET PROFIT EBITDA EBITDA MARGIN REVENUE TOTAL INCOME PROFIT BEFORE TAX TEXTILE INDUSTRY YARN BUSINESS HOME TEXTILES PAPER AND CHEMICALS NET DEBT DEBT REDUCTION ₹4 650-CR NATIONAL
INDIA
By IFAB MEDIA - NEWS BUREAU - November 4, 2026 | 73 8 minutes read





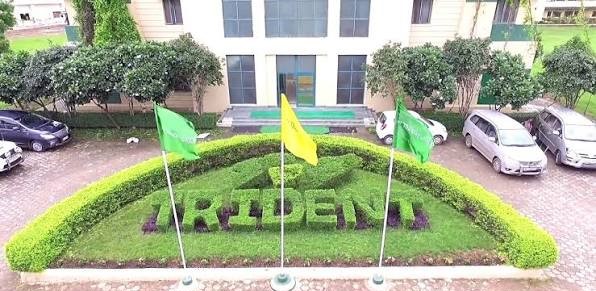
Trident Limited has reported financial results for the Second quarter ended 30th Sep 2026.
Financial highlights for Q2FY27:
- Consolidated Total Income is INR 1737 Crore in Q2FY27 in comparison to INR 1803 Crore in
- Consolidated EBIDTA for the quarter is INR 337 Crore at 19%, up 6% QoQ and 45%
- Consolidated Net Profit for the quarter is INR 176 Crore at 10%, up 11% QoQ and 93%
Financial highlights for H1FY27:
- Consolidated Total Income of INR 3540 Crore, up 3% YoY.
- Consolidated EBIDTA is INR 653 Crore as compared to INR 544 Crore in H1FY26, up 20%
- Consolidated Net Profit is INR 334 Crore, up 45%
- Net Debt stands at INR 722 Crore on Sep 30, 2026 as compared to INR 1025 Crore as on June 30, 2026, a reduction of INR 304 Crore.
Commenting on the results, Deepak Nanda, Managing Director, Trident Limited, said, “During Q2FY27, Trident Limited delivered a resilient performance with consolidated revenue of INR 1,737 crore and EBITDA of INR 337 crore, resulting in an EBITDA margin of 19.4%, an improvement of 653 bps over the corresponding quarter last year. The quarter witnessed strong growth in profitability, with Profit Before Tax increasing by 87.6% to INR 232 crore and Net Profit rising by 93.1% to INR 176 crore over the corresponding quarter last year, supported by our continued focus on operational excellence, cost optimization, product mix enhancement, and disciplined execution across businesses.
Pleased to update that the Board has approved INR 4,650 crore expansion and modernization programme, underscoring our confidence in the long-term growth potential of the textile and paper sectors. The proposed investments include significant capacity additions in yarn, sheeting, and paper businesses, establishment of a new yarn manufacturing facility at Dhar, Madhya Pradesh, and development of a 60 MW hybrid renewable energy project. These investments will enhance our manufacturing capabilities, improve operational efficiencies, reinforce our cost competitiveness and make our operations sustainable.
As we continue to focus on profitable growth and value creation, this strategic expansion will position Trident to capitalize on future opportunities, serve customers more effectively across global markets, and create sustainable long-term value for all stakeholders”.
Business Performance:
- Yarn business consolidated revenue for the Q2FY27 is INR 1019
- Home Textile business consolidated revenue for the Q2FY27 is INR 882
- Paper and Chemicals business consolidated revenue for Q2FY27 is INR 288
Financial Performance on Consolidated basis:
(All figures in INR Crore, unless stated otherwise)
|
Particulars |
Q2FY27 |
Q1FY27 |
QoQ Change |
Q2FY26 |
YoY Change |
|
Total Income |
1737 |
1803 |
(3.67%) |
1803 |
(3.67%) |
|
EBITDA |
337 |
316 |
6.36% |
232 |
45.25% |
|
EBITDA % |
19.37% |
17.55% |
183bps |
12.85% |
653bps |
|
Depreciation |
72 |
70 |
1.89% |
83 |
(13.71%) |
|
Finance Cost |
33 |
30 |
8.47% |
25 |
30.85% |
|
PBT |
232 |
216 |
7.51% |
124 |
87.55% |
|
PBT % |
13.38% |
11.99% |
139bps |
6.87% |
651bps |
|
Net Profit |
176 |
158 |
11.06% |
91 |
93.09% |
|
Cash Profit |
247 |
228 |
8.24% |
174 |
42.17% |
|
EPS (Rs.) |
0.34 |
0.31 |
11.06% |
0.18 |
93.09% |


